As part of the Data visualisation and communication course from the EPFL extension school, which I already mentioned in a previous post, one of the optional tasks after finishing the first of four sub-courses was to find timeseries data and plot it. A very open question! There is so much timeseries data – the vast majority of the academic data I have worked with as well as quite some of the data I met in industry were timeseries. I needed to choose something, and decided to find something I haven’t worked with before, namely open government data. I wanted to look at the number of people living in Switzerland – Swiss nationals and foreigners – but additionally show what proportion of the Swiss nationals has/had the right to vote. This could later be compared and contrasted with e.g. the numbers of signatures required for a referendum.
The first task in such a case is to find appropriate data. In this case, opendata.swiss as well as the Swiss Federal Statistical Office might have some of the data I want. It turns out the latter had almost what I wanted – number of residents in Switzerland based on whether they are Swiss or not, but ‘only’ since 1951. Oh well, that’s a start. Plus information on voters for every national election since 1919, i.e. with data every four years.
The second task is to read and clean the data. Then arrange it in a way that lends itself to plotting, and then try out some plots. And then tinker with the plot – the overall theme, the colors, the order in which the different categories should be shown, the best way to show the legend – the possibilities are endless! I tried some of them, as you can retrace in the code, available on github, and finally came up with this plot:
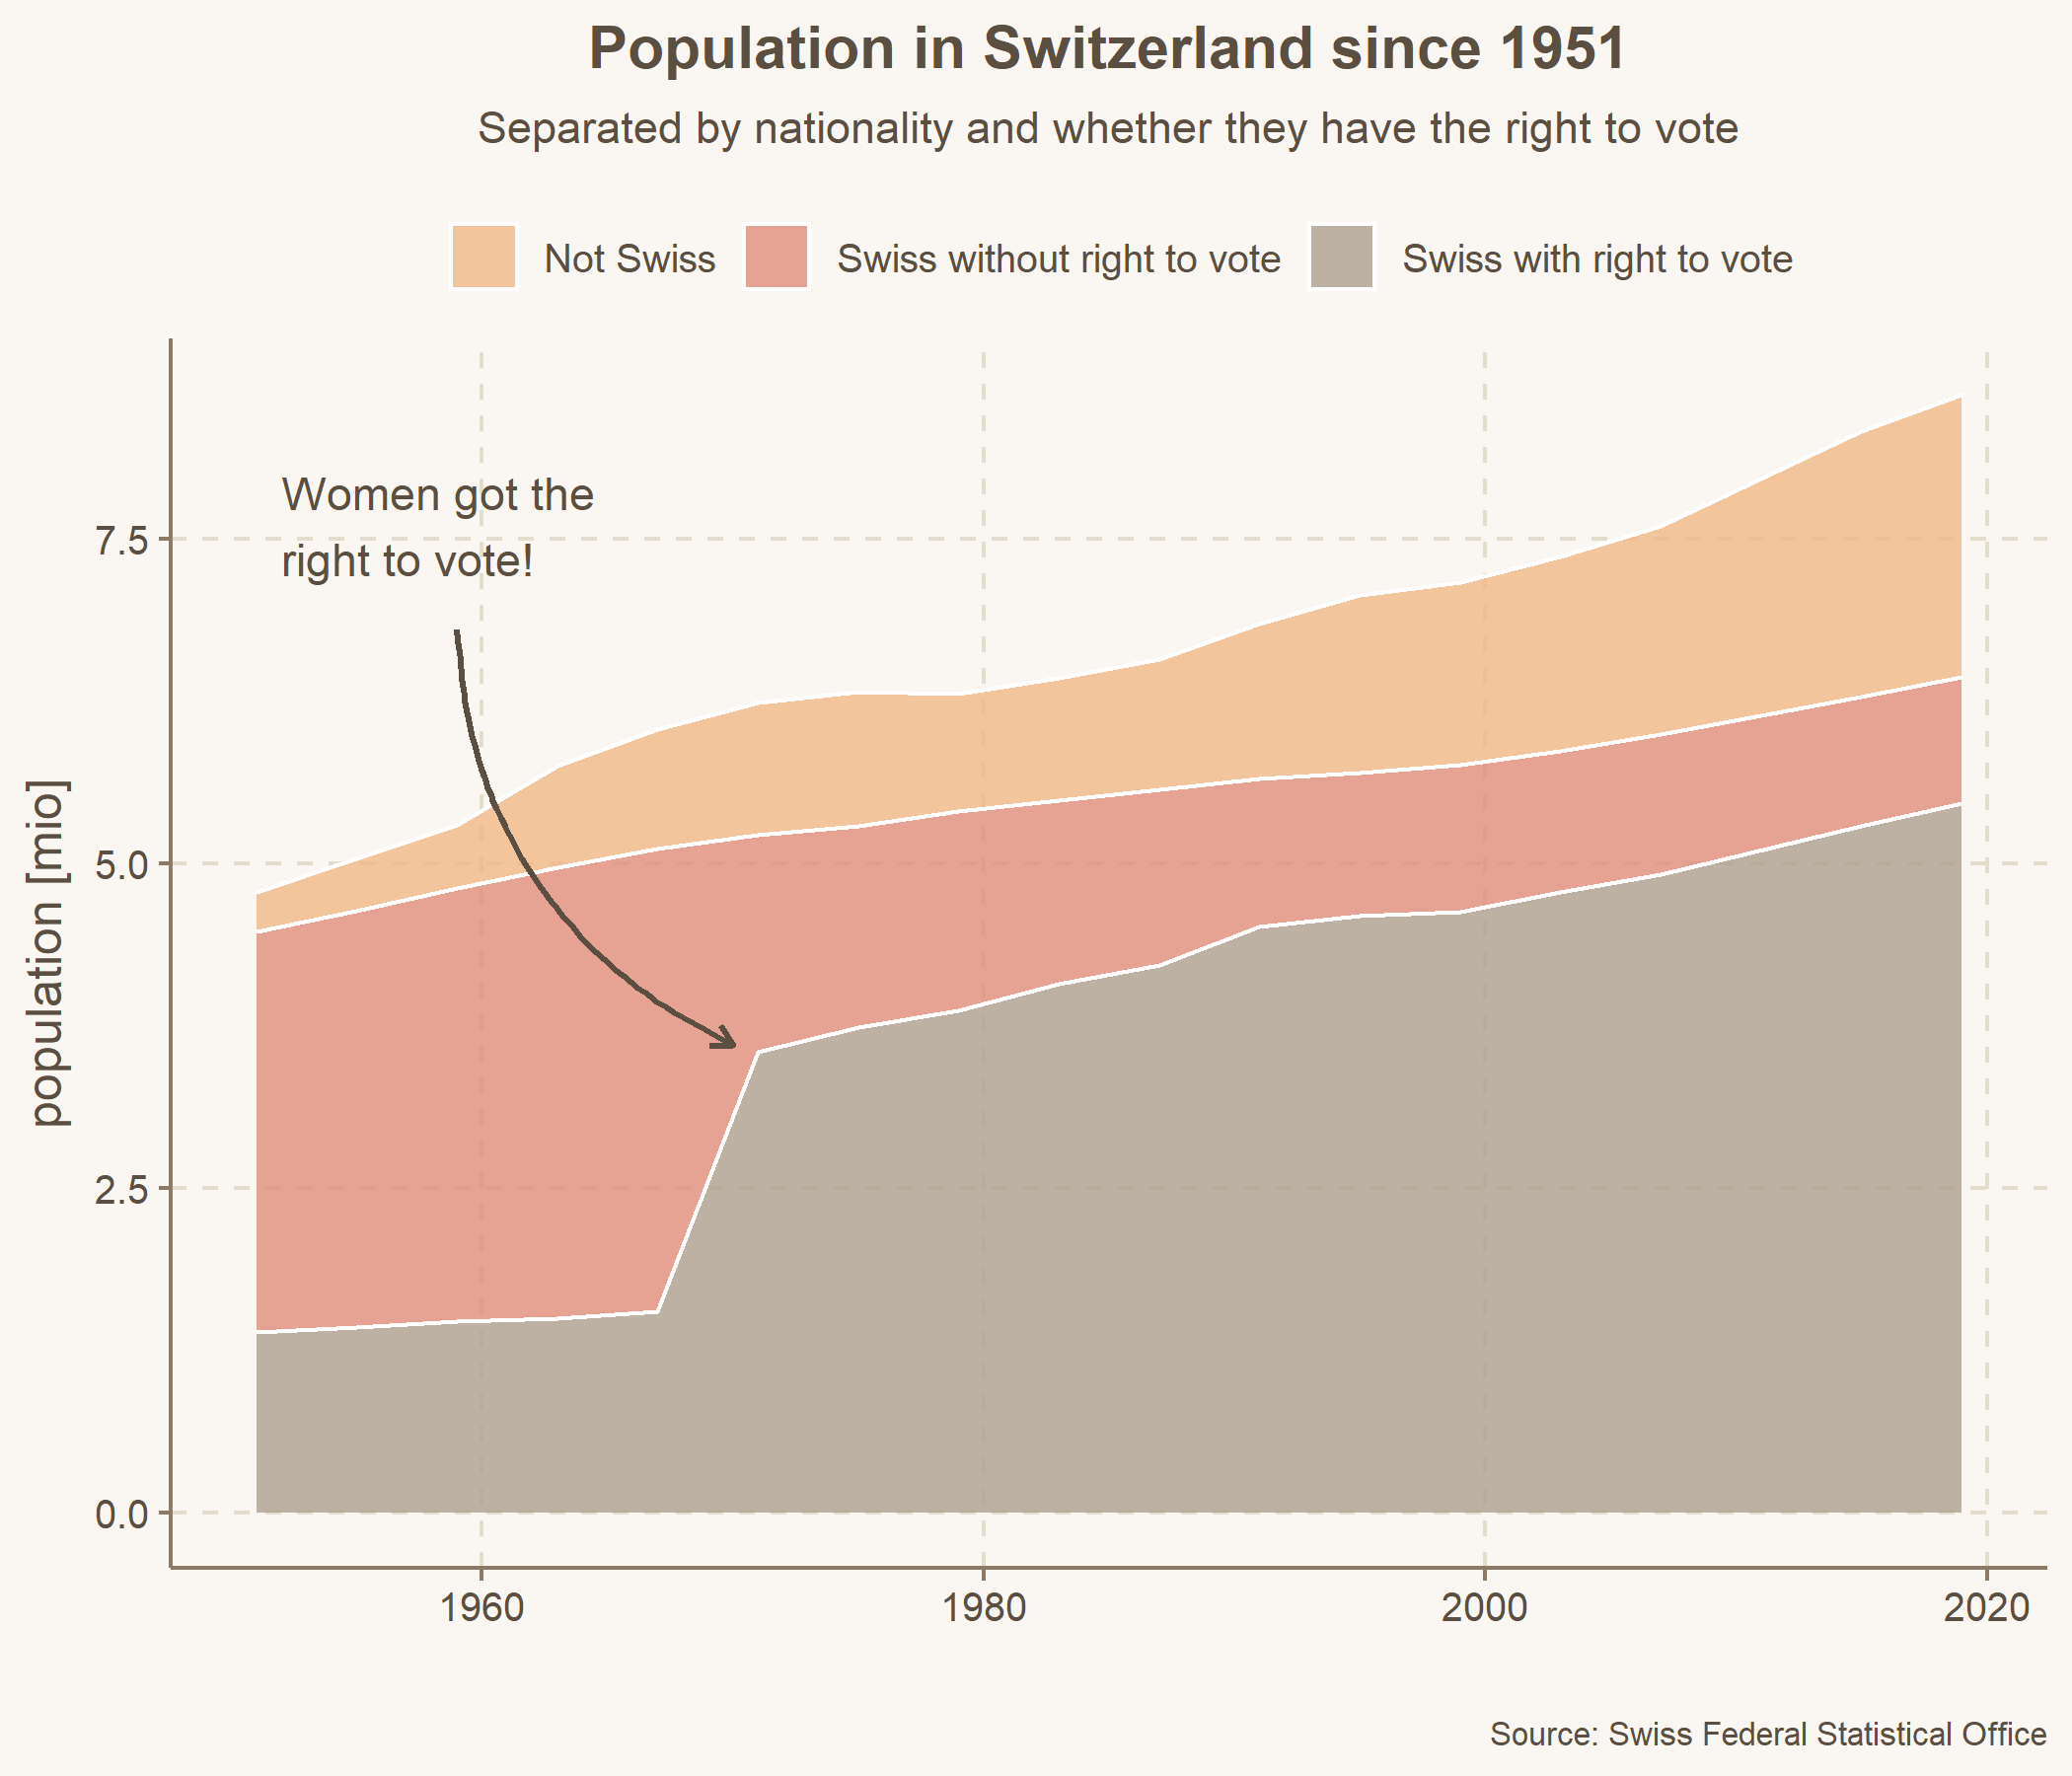
The most obvious feature is the one I highlighted: Women got the right to vote in 1971, meaning the proportion of Swiss people allowed to vote more than doubled (1.5 to 3.5 million people)! There are also some other points which we can learn from this plot:
- Between 1951 and 2019, the population living in Switzerland increased from 4.8 to 8.6 million people, representing an increase of 80% – quite some growth!
- The increase is more marked for the foreign population (600%) than for the Swiss population (44%).
- This means that in 2019, 25% of people living in Switzerland were foreigners – without the right to vote.
- The second category without the right to vote, Swiss nationals who are under the age limit for voting or for other reasons are not allowed to vote, has decreased since women got the right to vote. My guess is that this is related to everyone getting older.
From these observations, we can ask further questions – which I won’t investigate further here, but I put them here because I like how a good plot answers some questions but also leads to new questions.
- How does this growth of the resident population of 80% since 1951 compare to other countries?
- How much of the high proportion of non-Swiss nationals living in Switzerland is related to the stringent naturalisation laws?
- How does the growth in residents compare to growth in other areas such as infrastructure or political measures? Unlike other parliaments, the Swiss one does not grow but has a fixed size. However I did look up one point: the number of signatures required to bring something to a popular vote. There are two types in Switzerland: one is the optional referendum (“Referendum” in German), which gets everyone to vote on a recent decision by parliament. The second one is the federal popular initiative (“Volksinitiative”), where basically any topic can be brought up for a vote. For both to happen, a certain number of valid signatures from people with the right to vote have to be collected – 50’000 for the optional initiative and 100’000 for the popular initiative. These numbers have remained stable since the late seventies (sources: here and here), while the number of people allowed to vote has increased by 41% 1). I am sure though that no political party wants to change this…
Footnotes:
1) This number is calculated based on voters living in Switzerland only. The correct way would have to include Swiss nationals living abroad as well, but I could not find data for those going back to the seventies.
[…] and communication course from the EPFL extension school, which I already mentioned in my previous post, was to plot some data with a relation to geography. Could be a map with some extra features, could […]